Application of Phase Diagrams with example
A binary system is capable of showing many factors of system and for system of known composition and temperature which is at equilibrium state there are majorly three type of information available as given below:
- Phases present in the system.
- Composition of phases.
- Percentage or fraction of the phases.
Phases present in the system:
Phase diagrams are able to define number of phases present in any system and it has a feature called the temperature composition point and to get number of phases present in that system we just have to locate temperature composition point on the diagram and number of phases present at that point will be total number of phases present.
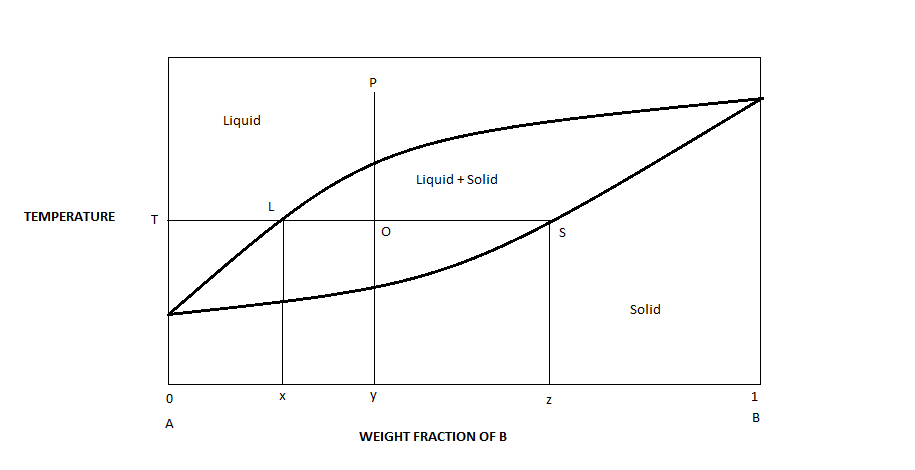
For example, an alloy of composition x at temperature T would be located at point O, as this point is within the two phase region, both solid and liquid phases will be present.
Composition of Phases:
Initial step to find phase composition is to find the temperature composition point on the phase diagram . If only one phase is present, the procedure is trivial, the composition of phase is simply the same as the overall composition of alloy
For example, in above diagram at point L, only solid phase is present. If the temperature composition point is traced at a particular temperature in two phase regions, we have to draw a line called ,Tie line. Tie line is a horizontal line drawn at a particular temperature in the two phase region of a binary phase diagram, this line is extended across the two phase region and terminate at the phase boundary lines on either side. Composition of the these phases can be understood after drawing perpendiculars from the intersection between the tie line and the phase boundaries to the horizontal composition axis.
For example consider an alloy of y composition at temperature T, located at point O and lying within the solid +liquid region. Thus we have to determine the composition of both of solid and liquid phase. The tie line has been constructed across the solid+liquid region. The intersection of tie line and phase boundaries are point-L and S for liquid and solid phase respectively. Therefore, composition of solid phase in equilibrium with liquid phase at temperature T for the alloy is z and x respectively.
Percentage or fraction of the phases:
The relative amounts of the phases at equilibrium may also be computed with the aid of phase diagrams. The solution is simple in the single phase region. Since only one phase is present , The alloy is composed entirely of that phase, that is, phase fraction is 1.0 or alternatively , the percentage is 100%.
If the composition-temperature position is traced within two phase region, things are more complex. The tie line must be utilized in conjunction with a procedure that is often called the lever rule. Lever rule derived from mass balance gives the relative amounts of the coexisting phases. It is applied as follows. The tie line is treated as a lever arm with the fulcrum as the overall composition. For the arm to be horizontal, weight to be hung at each end must be proportional to the arm length on the other side of the fulcrum. The weight at each end corresponds to the amount of the phases at the end.
To understand the lever rule let us consider a binary equilibrium phase diagram of two elements A and B in above diagram, which are completely soluble in each other. Let P be the alloy composition of interest and its weight fraction of B in A be y.
Let T be the temperature of interest and let us construct a tie line at temperature T from the liquid line to the solidus line. At temperature T, the alloy P consist of mixture of liquid of x weight fraction of B and solidus of z weight fraction of B.
Weight fraction of solid phase = OL / SL
Weight fraction of solid phase = SO / SL


