Phase Diagrams |Binary Phase Diagrams
Phase Diagrams:
A phase in a material in terms of its microstructure is a region that differs in structure and or composition from another region.
Phase diagrams are graphical representation of what phases are present in a material system at various temperatures, pressure and compositions. Some of the most important information obtainable from phase diagrams are as follows. Read Applications of phase diagrams here.
- To indicate the equilibrium solid solubility of one element in another.
- To show what phases are present at different compositions and temperature under slow cooling condition.
- To indicate the temperature at which different phases start to melt
- To indicate the temperature at which different phases start to melt.
Binary Phase Diagrams:
A mixture of two metals is called a binary alloy and constitutes a two-component system, since each metallic element in an alloy is considered a separate component. For example, Cu is a one-component system, Whereas an alloy of Cu and Ni is a two component system. A compound in an alloy is also a separate component, For example, Fe-Fe3C.

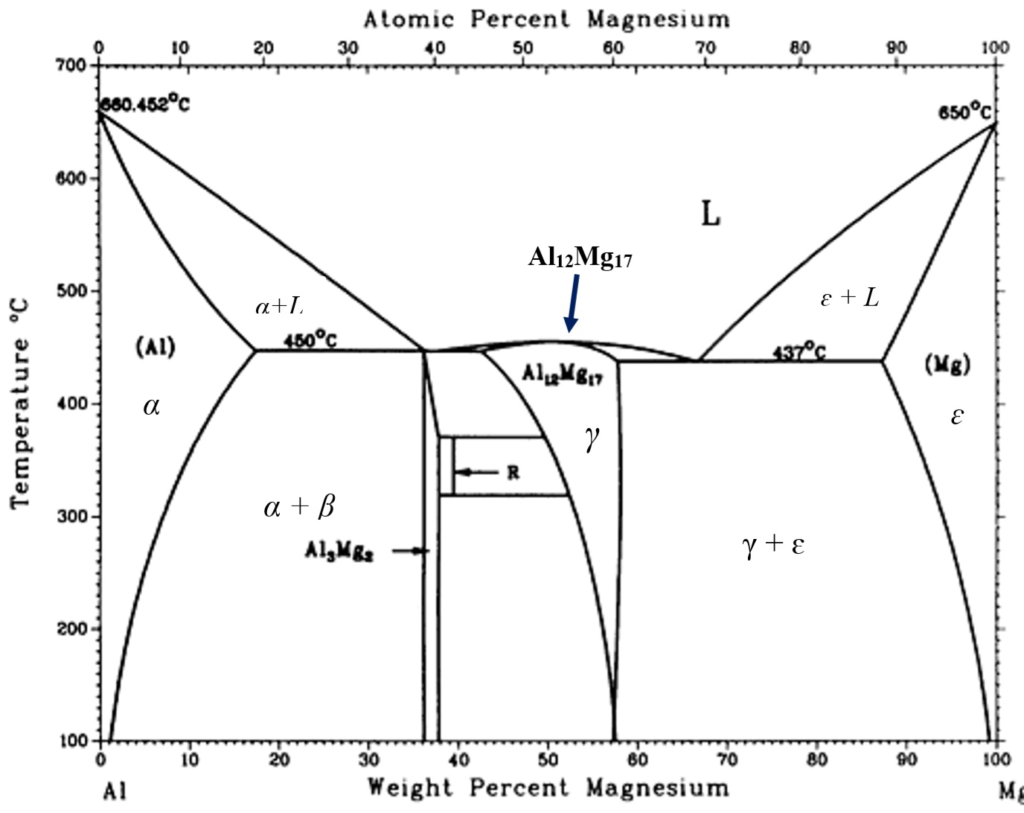
Two component systems are usually presented in binary phase diagrams. Here, apart from temperature and pressure, composition is also a variable. Therefore, Three dimensional diagram is needed to plot the variation in temperature, Pressure and composition. In order to simplify the presentation of the phase relationship on paper.
Binary phase diagrams are usually drawn at constant pressure, Showing variation of temperature and composition only. Pressure changes often produce no significant effect on the equilibrium and therefore, it is compulsory to ignore the pressure variable and the vapour phase. In such cases, One of the variable has arbitrary been omitted and the phase rule for the condensed phases is written as
F = C – P + 1


Recent Comments